Since the value of t(n) is required to predict the point t(n-1), and t(n-1) is unknown, it is necessary to make recursive predictions in which, each new prediction, is based on the previous one. This process is known as recursive forecasting or recursive multi-step forecasting.
The main challenge when using scikit-learn models for recursive multi-step forecasting is transforming the time series in an matrix where, each value of the series, is related to the time window (lags) that precedes it. This forecasting strategy can be easily generated with the classes ForecasterAutoreg and ForecasterAutoregCustom.
# Create and fit forecaster# ==============================================================================forecaster=ForecasterAutoreg(regressor=Ridge(),lags=15)forecaster.fit(y=data_train)forecaster
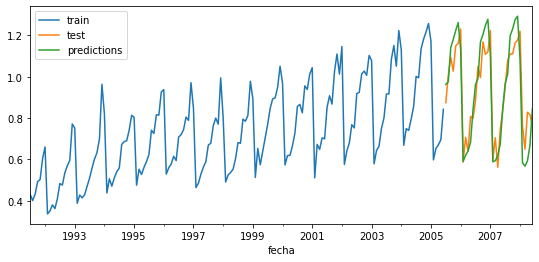
# Predict# ==============================================================================steps=36predictions=forecaster.predict(steps=steps)# Add datetime index to predictionspredictions=pd.Series(data=predictions,index=data_test.index)predictions.head(3)
# When using as regressor LinearRegression, Ridge or Lassoforecaster.get_coef()# When using as regressor RandomForestRegressor or GradientBoostingRegressor# forecaster.get_feature_importances()